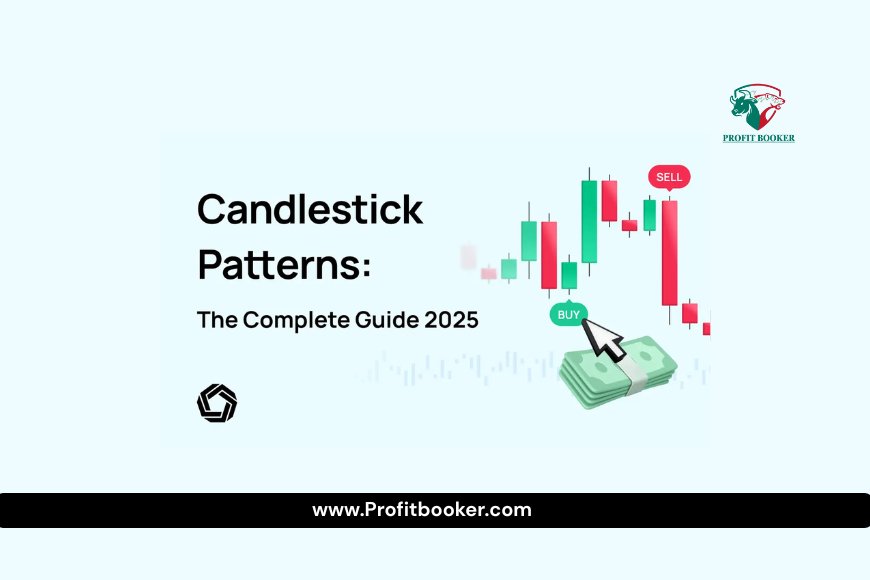
How to Read Forex Charts Like a Pro (2025 Guide): Master Candlesticks & Indicators
Learn how to read forex charts like a pro in this 2025 guide. Master candlestick patterns, technical indicators, and chart analysis to improve your trading skills. Perfect for beginners and experienced traders who want to make smarter forex decisions and boost profitability. Simple, clear, and effective tips included.
If you’ve ever looked at a forex chart and thought, “This looks like a foreign language”, you’re not alone. But here’s the good news — reading forex charts isn’t rocket science. Once you understand candlesticks and indicators, those confusing lines and shapes turn into clear trading signals.
In this guide, we’ll break down everything you need to know — from chart types and candlestick patterns to the most powerful indicators pros use. Whether you’re a beginner or looking to sharpen your skills, by the end you’ll read charts like a pro.
1. Why Forex Charts Are Your Trading GPS
In forex, guessing is gambling. Charts give you the map you need to navigate the market.
With forex charts, you can:
-
See where the price has been (history)
-
Spot patterns that hint at future moves
-
Identify strong entry and exit points
-
Understand market sentiment
Without charts, you’re driving blind.
2. The 3 Main Types of Forex Charts
Before diving into candlesticks, let’s quickly cover the chart types you’ll encounter.
2.1 Line Chart
-
Connects closing prices over time.
-
Simple and clean — great for beginners.
-
Weak point: no highs, lows, or opening prices.
2.2 Bar Chart (OHLC)
-
Shows Open, High, Low, Close prices for each period.
-
More detailed than line charts.
-
Can be harder to read at a glance.
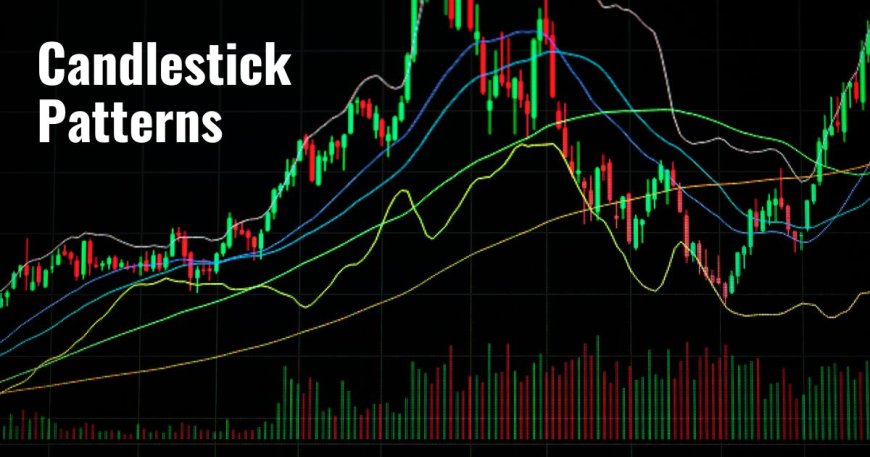
2.3 Candlestick Chart (The Trader’s Favorite)
-
Shows the same OHLC data but in a visually clear way.
-
Color-coded for up (green) and down (red) movements.
-
Easier to spot patterns and reversals.
3. How to Read Candlesticks
Every candlestick tells a story about market battles between buyers and sellers.
Parts of a candlestick:
-
Body: The range between the opening and closing price.
-
Wick/Shadow: High and low price during that time.
-
Color:
-
Green (bullish): Price closed higher than it opened.
-
Red (bearish): Price closed lower than it opened.
-
Pro Tip:
-
Long body = strong momentum.
-
Long wick = rejection of higher/lower prices.
-
Small body = indecision.
4. Must-Know Candlestick Patterns
Bullish Signals
-
Hammer: Small body, long lower wick — signals potential reversal after a drop.
-
Bullish Engulfing: Large green candle swallowing the previous red candle — buyers taking control.
-
Morning Star: Three-candle pattern showing bearish-to-bullish reversal.
Bearish Signals
-
Shooting Star: Small body, long upper wick — price likely to reverse down.
-
Bearish Engulfing: Large red candle overtakes a green one — sellers dominate.
-
Evening Star: Opposite of Morning Star — signals a bearish shift.
5. Understanding Chart Timeframes
Different traders use different timeframes:
-
Scalpers: 1–5 min charts (fast trades)
-
Day Traders: 15 min – 1 hour
-
Swing Traders: 4-hour – daily
-
Long-term Investors: Weekly – monthly
Rule: The higher the timeframe, the more reliable the signal.
6. The 5 Most Powerful Forex Indicators
Indicators are your confirmation tools. Pros rarely trade on candlesticks alone.
6.1 Moving Averages (MA)
-
Smooth out price fluctuations to show trend direction.
-
SMA: Simple average over time.
-
EMA: Gives more weight to recent prices.
-
Popular combo: 50 EMA & 200 EMA for spotting trends.
6.2 Relative Strength Index (RSI)
-
Measures overbought/oversold levels (0–100).
-
Above 70: Overbought — potential drop.
-
Below 30: Oversold — potential rise.
6.3 MACD (Moving Average Convergence Divergence)
-
Tracks the relationship between two moving averages.
-
Bullish when MACD crosses above signal line.
-
Bearish when it crosses below.
6.4 Bollinger Bands
-
Show volatility using a moving average and upper/lower bands.
-
Price touching the upper band = potential overbought.
-
Price touching lower band = potential oversold.
6.5 Fibonacci Retracement
-
Uses key ratios (23.6%, 38.2%, 61.8%) to find support/resistance.
-
Great for spotting pullback entry points.
7. How Pros Combine Candlesticks & Indicators
Example Pro Strategy:
-
Spot a bullish candlestick pattern (e.g., Hammer).
-
Check RSI — is it oversold?
-
Look at moving averages — is the trend up?
-
Place trade with stop-loss below candle’s low.
8. Common Forex Chart Mistakes
-
Using too many indicators (information overload).
-
Ignoring higher timeframes.
-
Trading without a clear plan.
-
Chasing moves without confirmation.
9. How to Practice Without Losing Money
-
Open a demo account with a broker.
-
Practice spotting patterns and applying indicators.
-
Keep a trading journal — write down your reasons for every trade.
10. Key Takeaways
-
Learn candlestick basics first — they’re the foundation.
-
Use 2–3 reliable indicators for confirmation.
-
Always check the trend on a higher timeframe.
-
Practice before risking real money.
Quick Forex Chart Reference Table
| Tool | Purpose | Pro Tip |
|---|---|---|
| Candlesticks | Show price action | Focus on reversal patterns |
| Moving Averages | Identify trend direction | Combine 50 EMA & 200 EMA |
| RSI | Spot overbought/oversold | Avoid entering extremes |
| MACD | Confirm trend & momentum | Watch crossovers for signals |
| Bollinger Bands | Measure volatility | Look for squeezes before breakouts |
| Fibonacci Levels | Find support/resistance | Use with existing trend |
Final Word:
Mastering how to read forex charts isn’t about memorizing 100 patterns — it’s about combining the right tools and reading market psychology. The more you practice, the faster you’ll turn those “confusing lines” into clear trading opportunities.