How to Draw Trend Line in Chart ?
Learn what trend lines are, how to draw them, and how to use them in trading. Discover uptrend and downtrend strategies with real chart insights.
How to Draw trend lines?
Trend lines are fundamental tools in technical analysis, used to identify and confirm market trends by connecting significant price points on a chart.
They serve as visual representations of support and resistance levels, aiding traders in making informed decisions.
FREE OPEN FOREX ACCOUNT :
- EXNESS : https://one.exnesstrack.org/a/v9lw1qe6cs?source=app
- DELTA EXCHANGE : https://www.delta.exchange/?code=profitbooker
Understanding Trend Lines:
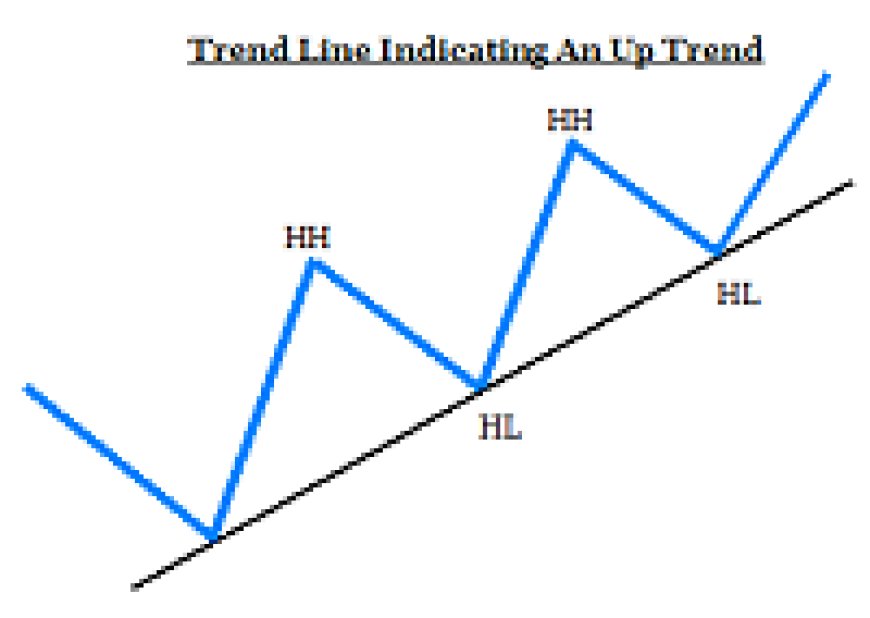
- Uptrend Lines: These lines have a positive slope, formed by connecting two or more low points where each subsequent low is higher than the
previous one. Uptrend lines act as support, indicating increasing demand as prices rise. A break below an uptrend line may signal a potential trend reversal.
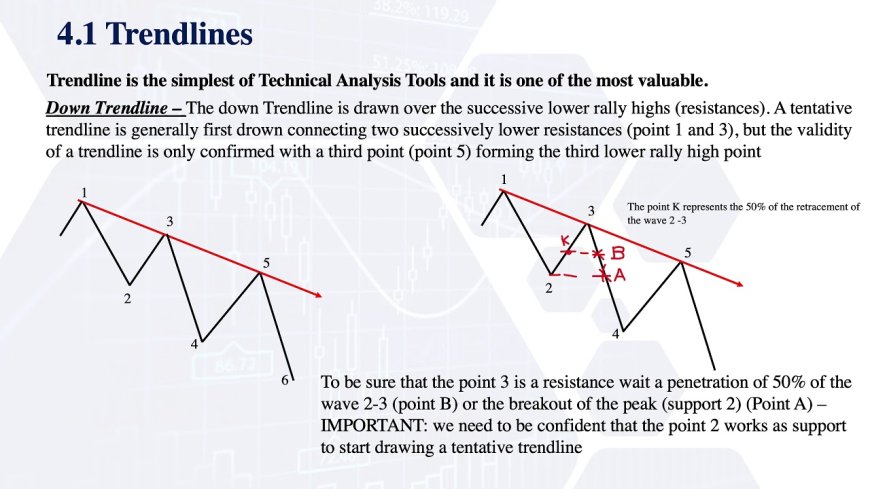
- Downtrend Lines: These lines have a negative slope, formed by connecting two or more high points where each subsequent high is lower than the
previous one. Downtrend lines act as resistance, indicating increasing supply as prices decline. A break above a downtrend line may suggest a potential trend reversal.
Drawing Valid Trend Lines:
- Use Higher Time Frames: Drawing trend lines on higher time frames (e.g., daily or weekly charts) often provides more reliable insights, as they reflect
significant price movements over extended periods.
- Connect Multiple Points: A valid trend line typically connects at least three significant price points. The more points a trend line connects, the more weight
it carries in indicating the strength of the trend.
- Consider Scale Settings: Be mindful of the chart's scale settings. Using a semi-logarithmic scale can be particularly useful when analyzing charts with large
price changes over time, as it displays incremental values in percentage terms.
FREE OPEN FOREX ACCOUNT :
- EXNESS : https://one.exnesstrack.org/a/v9lw1qe6cs?source=app
- DELTA EXCHANGE : https://www.delta.exchange/?code=profitbooker
How To Drow it ?
Using Trend Lines in Trading:
- Support and Resistance: Trend lines act as dynamic support and resistance levels. In an uptrend, the trend line serves as support; in a downtrend, it serves
- as resistance. Price reactions at these lines can offer trading opportunities.
- Trend Reversals: A break of a trend line can signal a potential reversal. However, it's essential to confirm such breaks with additional indicators or analysis
- to avoid false signals.
- Risk Management: Traders often use trend lines to set stop-loss orders. For example, placing a stop-loss just below an uptrend line can help limit potential
- losses if the trend reverses.
Best Practices:
- Avoid Forcing Trend Lines: Don't adjust trend lines to fit the data artificially. If the trend line doesn't naturally connect significant points, it may not be a
- valid representation of the market trend.
- Use in Conjunction with Other Tools: While trend lines are valuable, they should be used alongside other technical analysis tools, such as oscillators,
- volume analysis, and chart patterns, to enhance trading decisions.
By mastering the use of trend lines, traders can gain valuable insights into market dynamics, identify potential entry and exit points, and improve their overall trading strategies.
----------------------------------------------------------------------------------------------------------------------------------------------------------------------------------------------------------------------------------------
How to Learn Stock Market Trading for Beginners | Step-by-Step Guide - READ MORE
How To Learn Crypto Trading - A Beginner’s Guide - READ MORE